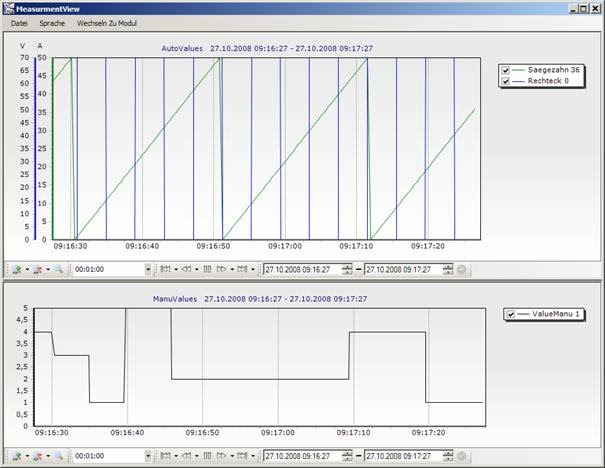
Configuration of the measured value display
Designing the surface
The measured value display appears in the default setting with a blank home screen. Pressing the right mouse button, a pop-up menu appears, which provides the following functions:
- Add to chart
Creates a new chart and places it on the clicked panel.
- Sharing – Horizontal
Divides the clicked panel into two superimposed subpanels.
- Sharing – Vertical
Divides the clicked panel into two adjacent subpanels.
- Delete
Deletes the panel you clicked on.
Chart configuration
The chart menu can be accessed by double right-clicking on the chart itself or simply right-clicking in its toolbar. It offers the following options:
- Navigation
Shows or hides the navigation bar.
- Zoom
Shows or hides the zoom bar.
- Date/Time
Shows or hides the date/time bar.
- Time
Shows or hides the time bar.
- Settings
Shows or hides the Settings bar.
- Channel Selection…
Opens the channel selection.
- Settings…
Opens the settings dialog for the chart.
- Delete
Deletes the chart and releases the underlying panel.
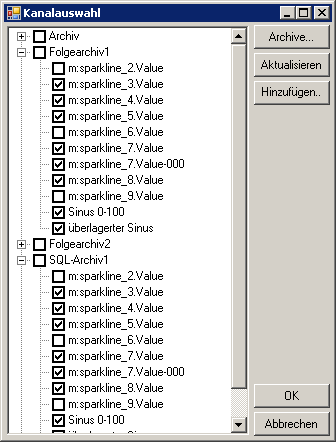
The channel selection looks like this:
 All archives in the module are displayed and – subordinately – the respective recorded channels are displayed. By setting check marks, it is possible to determine which channels should be displayed in the chart. If a channel has already been recorded in multiple archives, it is automatically selected in all archives. Via the Button Archive… additional, module-external archives can be added. About Adding… the MeasurementLogger editor can be started to add new channels.
The chart options offer the following settings:
- Title
Title for the chart. Displayed above the chart.
- Update
- Interval
Determines the interval at which the chart should be updated (i.e. redrawn). This is for better performance. The higher the value, the less frequently the chart is updated, the lower the CPU usage.
- Draw points immediately
Indicates whether to update each new point. If this setting is active, the refresh interval is ignored. If there are performance issues, this setting should be disabled.
- Legend
- Visible
Determines the visibility of the legend.
- Width
Defines the legend width in pixels. Depending on the length of the channel names, the value must be adjusted accordingly.
- Checkboxes
Determines the visibility of the checkboxes.
- Axis defaults
- Position
Determines whether axes are to the left or right of the chart.
- Grid
Specifies whether to draw horizontal lines from the y-axes in the chart.
Chart operation
In principle, you can move in the chart with the right mouse button pressed and zoom the chart by pressing the left mouse button. In addition, the following bars are available:
- Navigation

With jumping back and forward, you can ‘scroll’ through the chart. The factor can be specified by the DropDown arrow next to the buttons, where the factor ‘1’ corresponds to a page. Forward and back rewind can be used to scroll through the chart. Scrolls as long as the button is pressed. Here, too, the scroll inge speed can be determined by means of a factor.
With pause or Playing can pause the scrolling of the chart with the current time or be restarted.
- Zoom

Zooming in enlarges the chart, zooms it out. The DropDown arrow can be used to determine whether the zoom should affect only the x-axis, only the y-axis, or both axes. Unzoom restores the original zoom.
- Date/Time

Here you can specify two dates and times between which data to display. The entry can be confirmed with Enter or by clicking on the check mark.
- Time

Here you can set which time range the chart should display. You can either select one of the predefined values in the DropDown list or enter your own value. The input format for a separate value is d.hh.mm.ss.f, which is days, hours, minutes, seconds, and fractions of a second (one to seven digits).
Commands
For the measurement display, a system group can be specified in the editor under . The configuration then automatically creates the string variables command, status and return.
Command strings can be sent to the measured value display via the command variable. The status variable provides information about the status of the currently processed command and enters the busy state during the execution of a command, while the state is otherwise on idle.
Regardless of the state, commands can be passed all the time because the incoming commands are buffered and processed sequentially. The simultaneous transfer of several commands in a string can be done separately by semicolon.
After the string is entered into the buffer, the measured value display resets the command string. Therefore, rewriting the command variable requires waiting until the command string is empty again.
The following commands are processed by the measured value display:
- Bringtofront
Brings the measurement visualization to the foreground.
- Minimize
Minimizes measurement visualization.
- Hide
Hides the measured value visualization.
- Show
Shows the measurement visualization (if the window is as an icon in the taskbar, it will be brought to normal size).
- Close
Stops the measurement visualization.
- StayonTop(Arg)
Sets or resets the attribute “In the foreground”
. Arg: true or false.
- SetAxis (Chart, Axis, LeftTime, RightTime)
Sets the display range of a chart for the selected axis. The parameters have the following meaning (case is not taken into account):
Chart: Name of the chart as it appears in the display.
Axis: Sets the axis to which the command refers (currently only bottom).
LeftTime (RightTime): Sets the left (right) limiting time range. The format corresponds to the VisXpert timestamp (‘HH:mm:ss, dd.MM.yyy’).
- LoadProject (FileName)
Loads a saved project. In the currently set project directory, it is displayed after a file with the specified name (e.g. chart01.xml) and loaded it, if present and valid.
- Online (ChartName, Status)
Turns automatic scrolling for a chart of the project on or off (status true or false). This covers the first chart whose name matches ChartName. (Case is not considered).
- Print (ChartName)
Prints the specified chart to the default printer.
- PrintDlg (ChartName)
Opens the TeeChart print dialog for the specified chart.
- Export (ChartName, File Name)
Exports the specified chart to the specified file, where the file extension determines the file format. The following are possible: .jpg, .xls, .txt, .csv
- ExportDlg (ChartName)
Opens the TeeChart export dialog for the specified chart.

